Revamped Program Reporting Dashboard

Revamped Program Reporting Dashboard

Revamped Program Reporting Dashboard

Revamped Program Reporting Dashboard

Varsity Tutors for Schools

Varsity Tutors for Schools

Varsity Tutors for Schools

Varsity Tutors for Schools

Building customer trust through usability and data transparency

Building customer trust through usability and data transparency

Building customer trust through usability and data transparency

Building customer trust through usability and data transparency

New reporting dashboard UI for Varsity Tutors for Schools
Wireframe exploration of the new Top Matches section

OVERVIEW

Varsity Tutors for Schools (VT4S)

This business segment was first launched in Fall 2021 and provides tutoring services at scale to K-12 school districts through contracted partnerships. School administrators use a dedicated portal to track student progress and understand program impact.

By the end of 2023, the scale and complexity of tutoring programs had greatly expanded. Over this period of time, the Administrator Portal had become outdated with significant data accuracy issues that were eroding trust with school district partners at a critical time leading up to contract renewals.

Problem

The portal suffered from unreliable data, poor user experience, and limited functionality that prevented school administrators from effectively monitoring their tutoring programs. With $40M in contract renewals at risk ahead of the 2024 ESSER funding deadline, administrators needed reliable insights to demonstrate program value and make data-driven decisions about renewals.

Outcome

In under two months, we delivered a redesigned portal that restored administrator confidence through real-time, accurate data reporting. The project established product principles and a scalable information architecture that supported both immediate business needs and long-term product vision, directly contributing to successful contract renewals during a critical period.

PROCESS

Discovery and Stakeholder Alignment

Given the limited access to busy school administrators and teachers, I collaborated closely with our Customer Success team and Head of Product to understand user needs through proxy research.

I facilitated focus groups with Customer Success Managers (CSMs) who work directly with administrators daily, combining their insights with feedback from the Head of Product who had direct relationships and frequent conversations with key district partners.

Through this research, I identified the primary reasons administrators log into the portal and categorized their data needs into three key organizational buckets:

  • Program Performance: Overall tutoring program metrics and ROI

  • Student Progress: Individual and cohort-level academic progress tracking

  • Usage Analytics: Session attendance, engagement, and resource utilization

CORE HYPOTHESIS:

Transparent, insightful reporting will build trust and drive sustained, meaningful engagement, leading to long-term positive outcomes for districts, students, and the business.

If we help tutors quickly identify opportunities where they're a top match, they'll prioritize responding to those opportunities first, leading to more top-decile assignments.

If we help tutors quickly identify opportunities where they're a top match, they'll prioritize responding to those opportunities first, leading to more top-decile assignments.

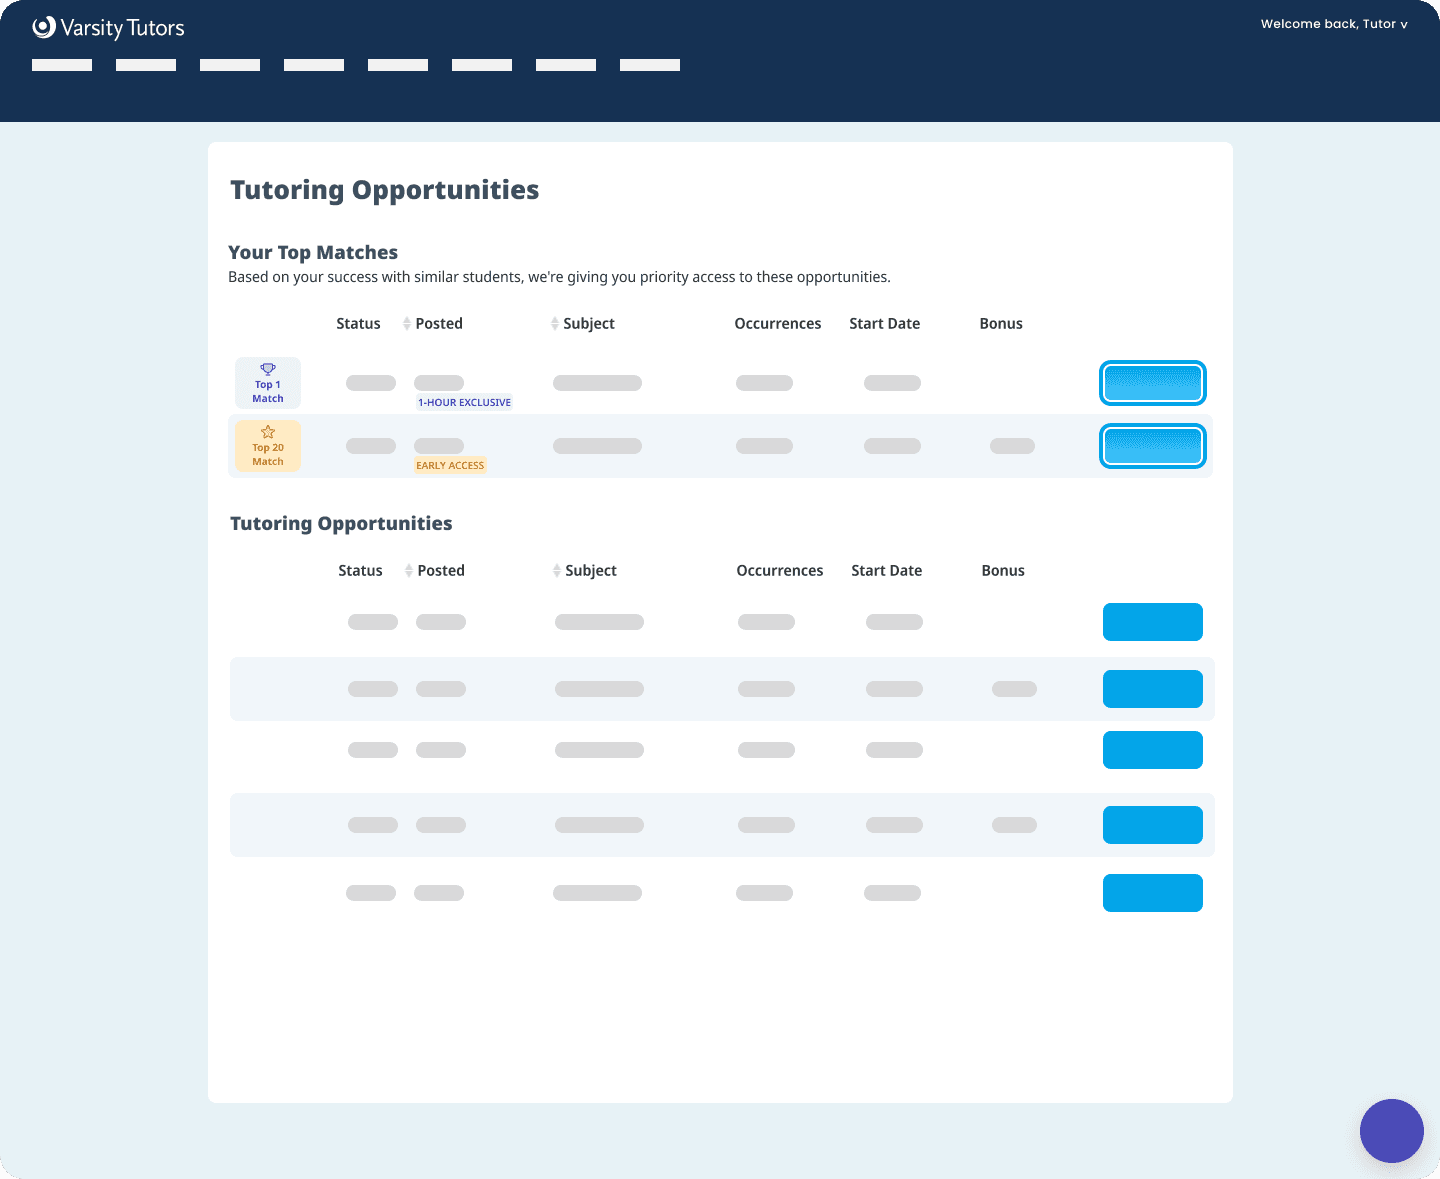
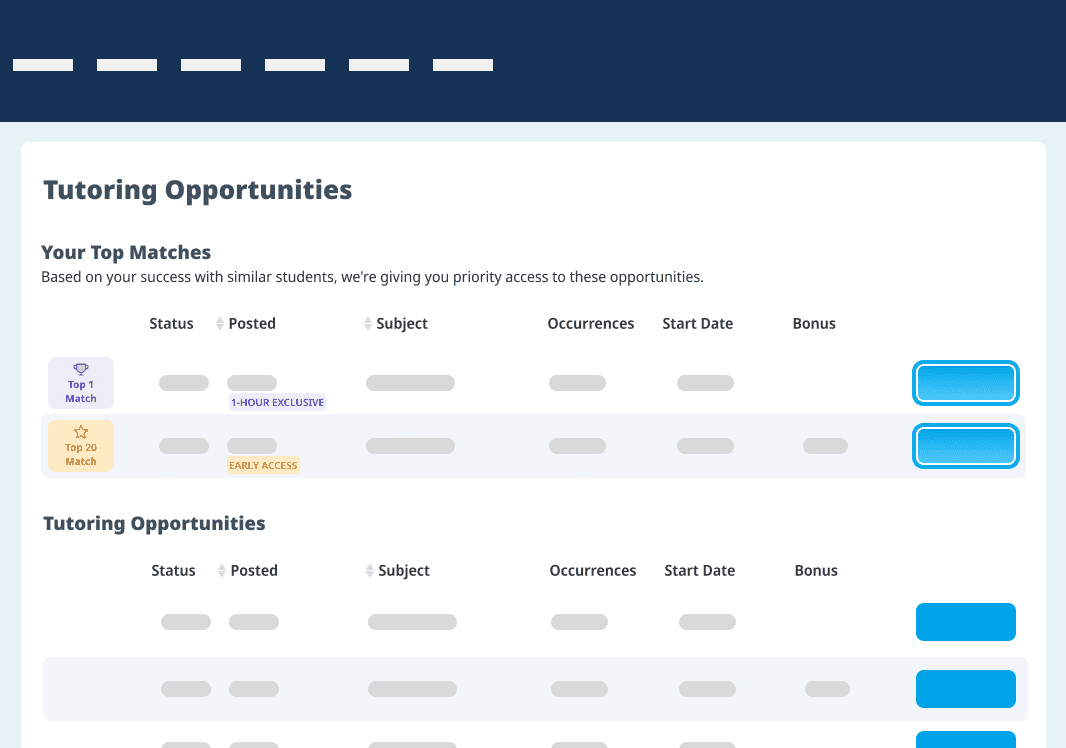
Establishing Product Principles:

Administrators are busy coordinating and executing on hundreds of different things and spending more than a few minutes at a time in our dashboard would be rare, so we needed to ensure the product was useful in that context.

Although our initial solution ideation included a wide range of promising options for a big redesign, we decided to test UI changes that would highlight and separate top-match opportunities from the general opportunity feed.

This led me to synthesize our research into a set of product principles that would guide decision-making based on this context.

I combined this context and principles into a shareable deck that would act as a reference for the team as we moved ahead quickly.

Although our initial solution ideation included a wide range of promising options for a big redesign, we decided to test UI changes that would highlight and separate top-match opportunities from the general opportunity feed.

CLARITY AND BREVITY EQUAL SPEED

Administrators are busy and just looking for answers. The UI delivers useful information clearly and quickly and makes it easy to dig deeper when needed.

CONSISTENCY creates LEARNABILITY

This product is one of a hundred tools our users interact with week-to-week. Consistent patterns make the product easier to learn and remember.

PERSONALIZATION OVER CUSTOMIZATION

Customization demands extra effort from users.
The Ul prioritizes and emphasizes the info we already know the user values based on their role and behavior.

INSIGHTS Lead TO ACTION, CREATING ACCELERATION

Administrators are responsible for supporting student outcomes. Timely, actionable insights help them achieve this, increasing and accelerating the value of their programs.

Although our initial solution ideation included a wide range of promising options for a big redesign, we decided to test UI changes that would highlight and separate top-match opportunities from the general opportunity feed.

We focused on a targeted intervention that would deliver immediate impact while minimizing initial engineering effort.

If our initial experiments confirmed our hypothesis, we could invest more heavily in revamping the opportunity system and UI in the future.

Competitive Analysis and Design Strategy

I conducted competitive analysis across both EdTech platforms and enterprise dashboards to understand navigation patterns and optimal data density. The key challenge was balancing information richness with usability—too little data would require excessive navigation, while too much would overwhelm non-technical users.

I conducted competitive analysis across both EdTech platforms and enterprise dashboards to understand navigation patterns and optimal data density. The key challenge was balancing information richness with usability—too little data would require excessive navigation, while too much would overwhelm non-technical users.

Through wireframe explorations and stakeholder testing, we aligned on a design that prioritized:

  • Role-based personalization that surfaced the most relevant metrics first

  • Clear visual hierarchy that guided users through complex information

  • Progressive disclosure that allowed administrators to drill into details when needed

Technical Constraints and Architecture Decisions

During technical review, the backend team identified critical performance concerns around data refresh rates, particularly when users applied time-range filters to large datasets that would pull data from multiple APIs. We aligned as a cross-functional product team to prioritize migrating our data and technical architecture from separate APIs from multiple data stores to GraphQL so that data from multiple sources would be more readily available and performant in the future.

During technical review, the backend team identified critical performance concerns around data refresh rates, particularly when users applied time-range filters to large datasets that would pull data from multiple APIs. We aligned as a cross-functional product team to prioritize migrating our data and technical architecture from separate APIs from multiple data stores to GraphQL so that data from multiple sources would be more readily available and performant in the future.

To avoid compromising the user experience in the meantime, I redesigned the filtering approach of the dashboard to move time-range controls to individual metric cards or smaller sets of related metrics that came from the same back end, enabling incremental data updates rather than full-page refreshes.

To avoid compromising the user experience in the meantime, I redesigned the filtering approach of the dashboard to move time-range controls to individual metric cards or smaller sets of related metrics that came from the same back end, enabling incremental data updates rather than full-page refreshes.

Unified Portal Strategy

Based on the previous version of the portal and our recent research, I knew administrator and teacher portal needs had significant overlap in information architecture, despite handling different datasets.

I facilitated a cross-functional workshop with Product and Engineering to map shared use cases and convinced the team to build a unified system with role-based permissions.

This decision allowed us to:

  • Maximize development efficiency through shared components

  • Ensure consistent user experience across roles

  • Build a scalable foundation for future portal expansion

Roadmap and Feature Prioritization

While initially prioritizing complex metrics drill-downs, technical review revealed that session recap functionality could be delivered faster due to existing backend data structures. I advocated for this strategic pivot, allowing us to deliver immediate value while building toward long-term capabilities.

The roadmap balanced immediate business needs (contract renewals) with sustainable product development:

Phase 1

Deliver the core dashboard with reliable real-time data

Phase 2

Update session recap functionality and implement basic drill-downs

PhasE 3

Build advanced analytics features and expanded administrative tools

Business Impact and Strategic Outcomes

The redesigned portal launched successfully before the critical contract renewal period, providing administrators with the reliable data insights they needed to demonstrate program value.

Beyond the immediate business impact, the project established:

A strong product foundation (for now and the future)

Having a clear, shared understanding of our users gave us a set of product principles and a scalable information architecture that guides ongoing development decisions.

Technical Scalability to support usability now and growth going forward

Close collaboration with engineering led to an intentionally designed software architecture that improved usability and product performance for existing users and would also support growing data volumes and user bases in the future.

User Trust Recovery

Reliable, transparent data reporting that rebuilt confidence with district administrators

Final Takeaways

The project demonstrated how strategic design thinking—balancing user needs, technical constraints, and business objectives—can deliver both immediate results and long-term product success.

The foundation we built continues to support VT4S growth and has enabled rapid iteration based on ongoing user feedback and evolving district needs.

Create a free website with Framer, the website builder loved by startups, designers and agencies.